I thought it was about time that I shifted my attention to an area that I have ignored thus far, the humble goalkeeper. As tends to be my style, I’ll do this through the use of detailed analysis and will attempt to reach the conclusion of which Premier League net minder posted the best performances last year.
I suppose before I go any further I should caveat and explain “best performance”.
I am looking solely at the shot stopping ability of keepers in this article, because that is what I have data for. Unfortunately, I don’t easily have data to hand which will tell me which keeper was most in command of their area or which one has the best distribution.
So by the end of this article I’ll be making a case for just who was the best shot stopper.
As an aside, as this piece has progressed, I feel that as well as addressing the topic at hand it also serves to remind us just how statistics and analytics can be used in different ways. Indeed, it also reaffirms the fact that looking at similar stats in a slightly different way can bring the reader to different conclusions.
One such example of this was my previous article where I looked at the difference in scoring rates between shots and headers, where it seemed that headers were scored more often than shots. But when the attempts were adjusted for pitch location it transpired that the oposite was actually the case. The data presented today isn’t as profound as the headers article, but there are similar subtle twists.
Data Rules
I have excluded penalties and the tables below only include goalkeepers who made at least 40 saves last season.
1 – Simple Percentage of Saves
The most basic metric we could use to see which keeper was the best shot stopper is the Save Percentage. This is simply calculated as (saves / number of shots on target faced):
Swansea’s reserve goalie Gerhard Tremmel is the only keeper to have saved more than 80% of the on target shots that came his way. The fact that Simon Mignolet saved much more of the shots that he faced in comparison to Pepe Reina is pretty well known by now, hence the acquisition seems to make sense for Liverpool.
It may come as somewhat of a surprise to see Hugo Lloris languishing towards the foot of the table. Tottenham were superb last season in terms of the paltry amount of shots that they conceded, but, in comparision to the rest of the league they allowed many more of those shots to turn into goals. Perhaps the style of play, principally the high pressing game they employed contributed to this fact.
This is a good time to mention that this analysis doesn’t take into account the amount of defensive protection that the goalkeepers received; it is purely looking at the shots that they faced.
Expected Saves
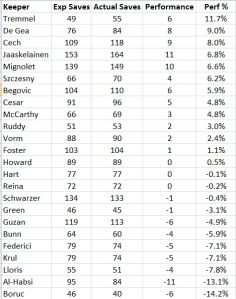
Another way of presenting this table is to compare the number of saves that the keepers made compared to the number of saves they would have made had they saved at the league average rate:
Tremmel made 55 saves, but had he saved the shots struck at him at just the league average rate he would only have made 49 saves. The additional amount of saves made of 6 has been described as “Performance”, and the final column, the “Perf %” shows the Performance as a percentage of their actual saves.
The 6 additional saves made by Tremmel’s represented an 11.7% over-performance by him. On the other side of the coin Artur Boruc underperformed by more than 14% as he made 6 less saves that expected.
In terms of absolute numbers, Jaaskelainen made the most amount of additional saves at 11 and Wigan’s Al-Habsi didn’t help his team’s chances of avoiding relegation as he conceded 11 more goals than the league average would have suggested.
I’m sure that Joe Hart, given his reputation and his position as the England number 1, will be disappointed at the lack of saves that he was able to make. His performance is actually in negative territory, ie worse than the league average.
One last interesting take away from the above table is that the sum of the Performance for those keepers that made at least 40 saves and thus were generally the starting keeper for their teams is 24. The league average is 0, which means that the sum of the Performances for the keepers I have omitted from the table (those with less than 40 saves) is -24.
This suggests, that by and large, the managers have made the right choices in terms of which keepers get to play and which tend to keep the bench warm.
2 – What about Headers?
At this stage, those aware of my work will probably have said “but surely you need to look at headers and shots separately due to the fact that they are scored at different rates”. And they would be correct.
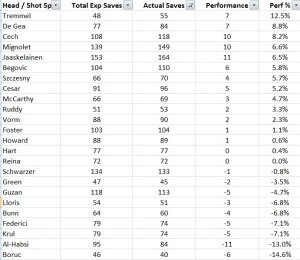
The Expected Saves figure in the above table has been arrived at by looking separately at headers and ground shots and using separate league average save rates for both headers and shots.
As it happens looking separately at headers and shots didn’t really change the ladder that much, the order is roughly the same and the Performance figures are also broadly similar; Lloris rises up the table a little bit and Mignolet sneaks into 4th place.
From this point on, all the Expected Saves quoted in this article will have the headers and ground shots kept separate, for no other reason than it is correct to do so.
3 – What about Shot Location?
Another favourite area of mine has been looking at where shots were taken from, and this variable is important in our quest to hunt out the best shot stopper.
It doesn’t require a person of great IQ to realise that a keeper who faces shots from long distances would be expected to have a higher save rate than a keeper who is being bombarded by shots centrally from 10 or 12 yards out.
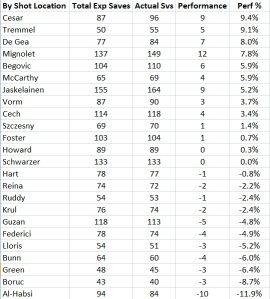
This time taking into account the location of where the shots were taken from, my Performance table now looks as follows:
When we take into account shot position a new name is now in contention for the title of “Best Shotstopper”; QPR’s Brazilian custodian Julio Cesar. It is interesting that by taking shot location into account Cesar has gone up the table, yet Rob Green has gone the other way. This suggests that Cesar faced shots which were more advantageous to strikers than those faced by his teammate Green.
4 – The Strike
Apart from the location of the shot, the final piece of the jigsaw that is required in order to be able to decide who the is best goalie is the placement of the actual strike at goal. Once again, it is obvious that a shot that is struck centrally will be easier to save than one that is arrowed for the corners.
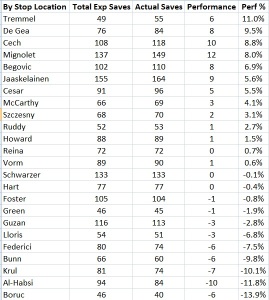
I broke the shot placement locations into 4 sectors, low centre, low sides, high centre and high sides, and this time after adjusting the saves for the locations of the shots faced I arrived at this position:
Once the placement of shots have been adjusted for Tremmel has once again fought his way to the top of the rankings table.
At this point it’s probably worth pausing to have a quick glance back over the previous tables in the article. The one thing that immediately stands out to me is the fact that the tables haven’t substantially changed.
Adjusting the expected saves for shot placement, location of shot and whether the shots where headed or from the ground has not substantially changed any of the tables; Joe Hart is still broadly neutral, Ali Al-Habsi and Artur Boruc are bringing up the rear and Swansea’s second choice goaltender is making great claims for a move to a starting position somewhere in the league.
The conclusion from this is that the sheer volume of shots faced by goalkeepers over a season ensures that they broadly get an even spread of all types of shot locations and shot placements. This will be reassuring to those who wish to keep a check on goalkeepers by simply using the Save % stat as posted at the top of this article.
However, as I have my hands on more dranular data I’m not satisfied by using such a simple metric and thus I’ll continue on with my final table.
5 – Final Table
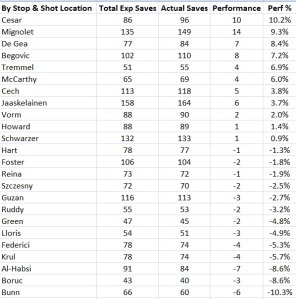
This table is the all singing and dancing table of a goalkeeper’s shot stopping abilities. The saves have been adjusted for the combination of whether the shots were headed or ground shots, their location and the shot placement.
The end result is that I’m crowning Julio Cesar as the best shot stopper in the Premier League, with an additional 10 saves made in addition to the 86 that the league average keeper would have saved.
Liverpool’s new Belgian keeper looks a really sound acquisition as he finishes as runner up, the Anfield club should notice the difference that Mignolet will bring them as Reina ends the table with 1 less save than the league average.
With an additional 14 saves Mignolet had the greatest absolute Performance, but Julio Cesar tops the table due to the higher Performance %, ie the Brazilian faced less shots and thus had less opportunities to chalk up those additional saves.
Assuming that QPR are keen to reduce their wage bill following their relegation last season I would propose that Julio Cesar could make a nice acquisition for someone. I have read recently that Arsenal have shown an interest in him, and it appears based on the above table that the Gunners could do with strengthening their goalkeeping options as Szczesny returned a poor Performance of -2.5%.
Swansea emerge with great credit from this analysis as they have two keepers in the Top 9 positions. In Manchester, David De Gea certainly repaid the confidence that Alex Ferguson showed him this season in making him first choice as he racked up 8% more saves than league average.
Depending on the feedback received it may be possible to monitor goalkeepers as the new season progresses using this methodology.
The Choice of Analysis
In my prelude I had said that a by-product of this article was how a subtle change in the statistics used can change the analysis and any conclusions. Although the general shape and feel of all the player ranking tables in this article are broadly similar it can be seen that the statistic used does have an impact when we want to get into specific detail. The top and bottom positions changed depending on whether we adjusted for shot location and / or shot placement.
This should serve as a timely reminder for all users of stats or analysis.

This is definitely one of the coolest statistical-analysis articles I’ve read. It will definitely help me for fantasy this upcoming season, and I’ll be following all of your articles. Thanks!
Thanks for taking the time to make those generous comments Eric.
I certainly enjoyed developing the article as the thoughts started to make sense in my mind.
Stats are misleading, Cesar was made to look good as our defence was terrible, More attacks = more changes for a keeper to make mistakes. Fact is, he dropped MANY clangers in important games. Check our forums, the majority like him but arent bothered if he leaves. Says it all.
More attacks = more changes for a keeper to make saves*, sorry Sunday morning typo
All the stats in the article were rebased so that the volume of saves a keeper was making is not important. I looked at the saves that he should have made given the shots faced, and my rankings were based on the additional percentage of shots saved. So absolute shots wasn’t important.
Sure he made mistakes, it’s the nature of keepers that everyone remembers them clearly but my figures (which adjusted the number of shots faced, the type of shot, the location of where it was struck and where in the goal it was headed) simply said that Cesar made the greatest percentage of additional saves than any other GK in the league.
Pingback: StatsBomb | EPL 2013/14 Season Preview – Liverpool
Pingback: StatsBomb | Goal Expectation and Efficiency
Stumbled upon your post while searching google for more granular goalkeeping data.
You post has answered most of the questions swirling around in my mind.
One thing I had in mind but haven’t found was % of “big chances” saved. Would you say shot position correlates to big chances? As in the reasonable expectation that an attacker should score from given chance.